Ray Studios
Independent media team
Not another tool. Just seeing the creative at last
Ray Studios runs its own performance, and runs it well. One blind spot remained: why a creative drops off, and what competitors keep running.
modules activated
blind spot covered
tools replaced

Marc Chapalain
Head of Growth
Media reporting stops where the creative begins
Ray Studios is not a team that suffers its numbers. Media management is in place, mastered, and needed no replacing. The problem wasn’t seeing performance: it was understanding what produces it, on the creative side.
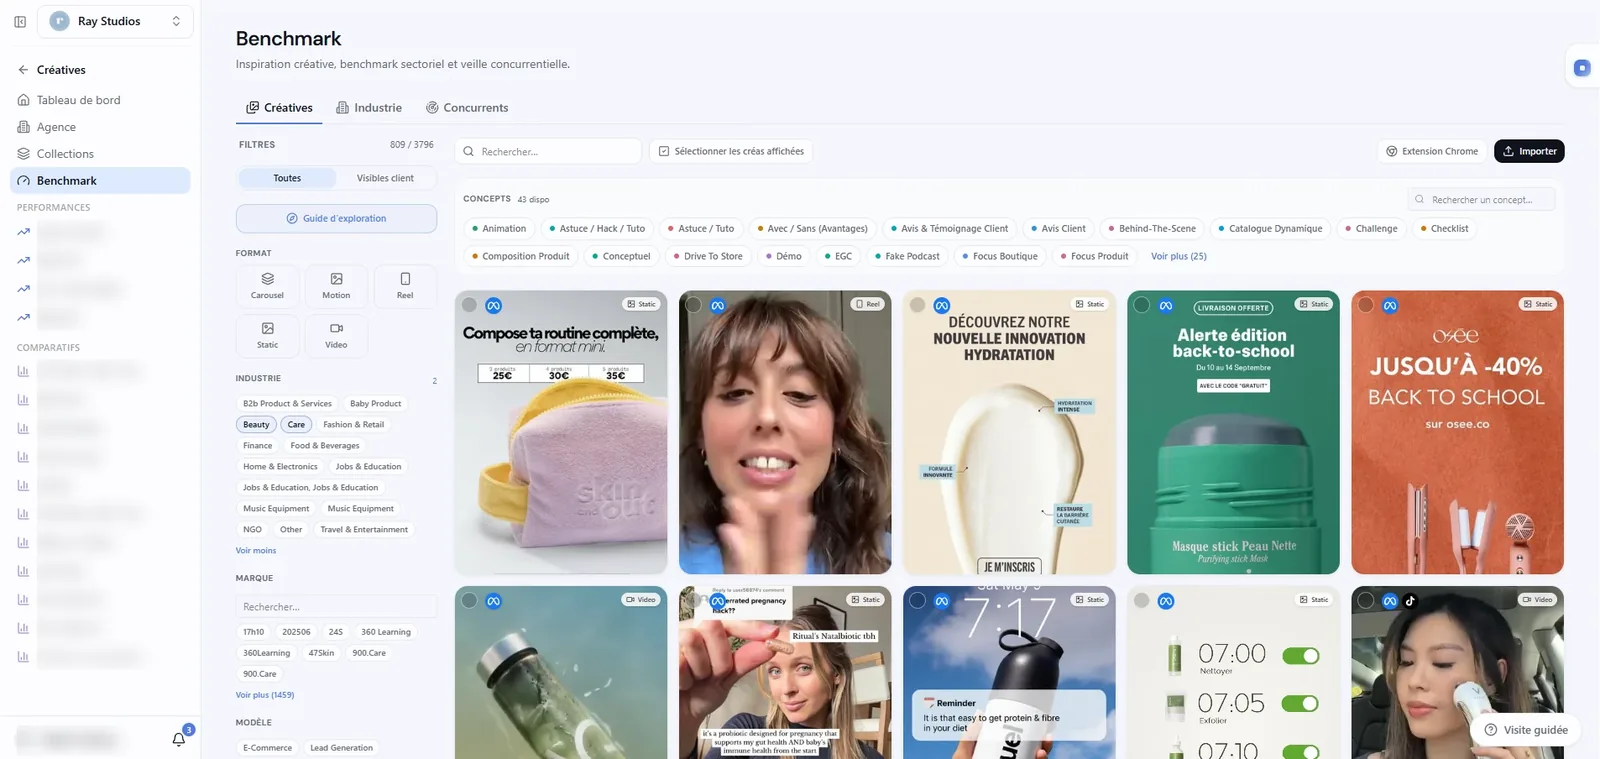
Ray Studios’ Benchmark interface in Nanga: 3,796 monitored creatives, filtered by format, concept, industry, and brand. Internal reports anonymized.
The dashboard says when, never why
A campaign drops off. CTR falls, CPA rises, the curve shows it. No media dashboard says whether the angle wore out, the format saturated, or a competitor just shipped the same promise, better.
Creative fatigue shows up too late
Without per-creative tracking, fatigue reads in the account-level CPA, when the budget is already gone. Yet the signal exists several days earlier, at the asset level.
Competitive monitoring is manual work
Opening ad libraries one by one, screenshotting, comparing from memory. A time-consuming ritual that produces no usable data, and that eventually stops happening.
Two modules, not a platform
Nanga is adopted brick by brick. Ray Studios activated the two that addressed its problem, and nothing else.
Creative Performances
Every asset is tracked individually: lifespan, tipping point, associated angle and format. Fatigue shows on the asset’s curve, not on the account’s CPA.
CreativeCreative Competitors
Competitor creatives are collected, dated, and classified by angle. You see what gets launched, what stays live for weeks, and what gets cut after three days.
MonitoringA foundation, not another platform
Ray Studios already runs its own performance and didn’t need another reporting tool. Nanga replaces nothing: it covers the one blind spot, the creative.
ScopeYour creatives, and the ones across the street
Switch between the view of your own assets and the market’s. It’s the only screen Ray Studios opens on top of its own.
Illustrative anonymized data. Angles and formats reconstructed for readability.
A reduced scope, by design
modules activated
Creative Performances and Creative Competitors, without the rest of the suite
blind spot covered
The creative reading, the one thing media reporting doesn’t provide
tools replaced
The existing performance stack stays in place, intact
monitoring freshness
Competitor creatives flow in continuously, no more manual sweeps
Scope indicators: they describe what the system covers for this client, not media performance at a point in time.
A campaign doesn’t wear out. An angle does
Seen from the account, a performance drop always looks the same: CPA rises. The reflex is to touch budget, targeting, bids. Seen at the asset level, the same drop tells another story: the creatives that fall off often share a common angle, regardless of format or launch date.
Competitive monitoring closes the loop. A creative a competitor keeps running for weeks is a creative that works: nobody pays to run a failure. Crossing your own fatigue curve with the lifespan of the creatives across the street means you stop guessing the next angle and start reading it.
Marc Chapalain, Ray Studios
Marc Chapalain
Head of Growth