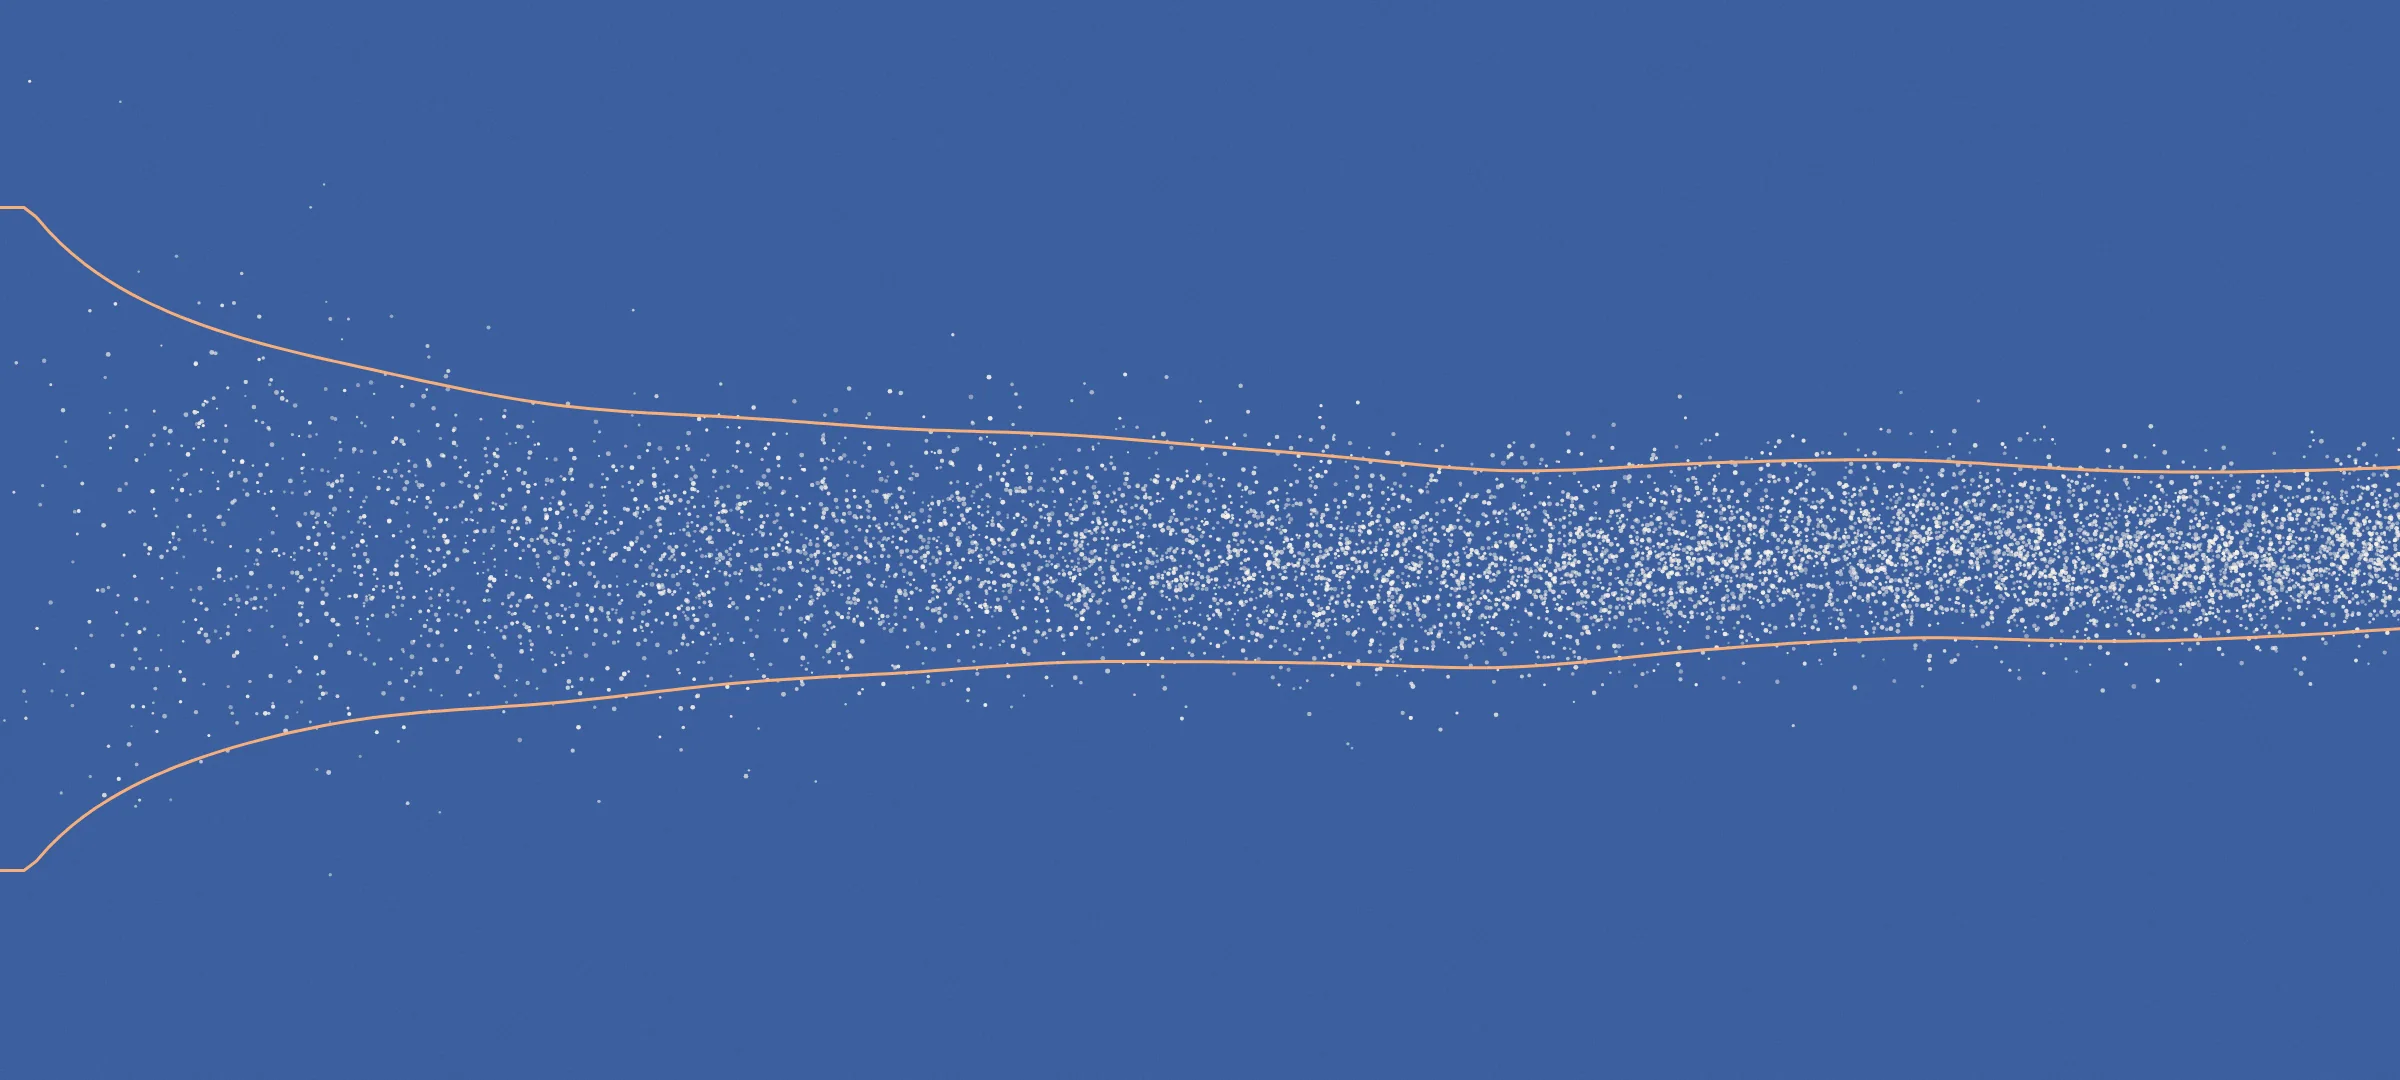
An AI visibility score becomes usable when its margin is smaller than the move that would change your decision. You can compute that threshold. For a brand present in 20% of answers, 100 prompts tracked on one engine give ±7.8 points at 95%, then ±11 to ±13 points if those prompts, spread over 5 topics, are moderately alike within each (assumption spelled out below). A 3-point rise in one week therefore proves nothing.
Three decisions follow. Size the panel for the smallest decision you intend to make. Add topics, not more prompts inside the same topics. Compare four weeks with four weeks. A lone prompt is for diagnosis, not measurement.
The tables below are my own calculations, from public formulas and stated assumptions. None of the studies on answer stability that I have read, as of 2 November 2026, supplies the number a CMO most lacks: how much the prompts in one panel move together.
Why does the same question get different answers?
Because an AI engine produces one answer among several possible ones each time it is asked. For a brand, the thing to estimate is a probability of being named, and each capture is one draw from it.
Not every layer of an answer varies equally. An audit by researchers at Maastricht, Utrecht and Zurich (Uberti-Bona Marin et al., September 2026) repeated 117 product queries three times. Mean overlap in exact cited pages between repeats is 18.1% on ChatGPT, 28.4% on Gemini and 41.4% on AI Overviews. Whether the answer names at least one brand or product changes in only 11 to 13% of queries, while recommended products barely overlap from one repeat to the next (0.178 on ChatGPT, on a scale of 0 to 1).
SparkToro and Gumshoe, which sells visibility tracking, found the same hierarchy in 2,961 answers collected by 600 volunteers in November and December 2025, with conditions left uncontrolled: under a 1 in 100 chance of seeing the same brand list twice, about 1 in 1,000 of seeing it in the same order. Yet City of Hope appeared in 69 of 71 ChatGPT answers and came first in only 25.
So a sample size only means something for a specific metric. This article deals with the most common one: the share of answers that name your brand.
What is the margin at 20, 50, 100, 200 and 500 prompts?
At 100 prompts, ±7.8 points for a brand at 20% and ±9.6 points for a brand at 50%. The table gives the 95% interval around an observed rate, with one capture per prompt on one engine. It uses the Wilson method, recommended in the NIST statistics handbook: its lower bound cannot go negative, unlike the textbook formula's.
| Prompts | Observed rate 5% | Observed rate 20% | Observed rate 50% |
|---|---|---|---|
| 20 | 0.9 to 23.6% | 8.1 to 41.6% (±16.8) | 29.9 to 70.1% (±20.1) |
| 50 | 1.6 to 14.9% | 11.2 to 33.0% (±10.9) | 36.6 to 63.4% (±13.4) |
| 100 | 2.2 to 11.2% | 13.3 to 28.9% (±7.8) | 40.4 to 59.6% (±9.6) |
| 200 | 2.7 to 9.0% | 15.0 to 26.1% (±5.5) | 43.1 to 56.9% (±6.9) |
| 500 | 3.4 to 7.3% | 16.7 to 23.7% (±3.5) | 45.6 to 54.4% (±4.4) |
Author's calculation, 95% Wilson interval, captures assumed independent. This is the best case for estimating a level.
Halving the margin takes four times the prompts. And the number that counts is the one in the cell you read, never the total on the contract:
- The topic. 100 prompts across 5 topics means 20 per topic, or ±16.8 points on each at 20%.
- The engine. 100 prompts on four engines make 400 captures, but each per-engine reading rests on 100.
- The denominator. Some answers leave the calculation. SE Ranking found an AI Overview on 52.63% of 100,000 French keywords (7 and 8 August 2026), so on a comparable panel 100 prompts would leave about 53 measurable answers on that engine. In the St. Gallen study cited below, 57.8% of ChatGPT runs had no citation at all: a rate computed on sourced answers only loses that much of its base.
Why do studies say 7, 10 or 100 runs?
They measure different things, and none of them gives the size to use for a whole panel.
| Source | Figure | Question addressed |
|---|---|---|
| University of St. Gallen, April 2026 | At least 7 runs per prompt per day, window of 2 to 4 weeks | One brand's rate on one prompt and one engine |
| SparkToro and Gumshoe, January 2026 | 60 to 100 runs | What an AI recommends on one question |
| Żatuchin, September 2026 | At the median, 10 calls recover 92.6 to 95.2% of the brands seen in 15 calls (89.5 to 94.7% after re-adjudication) | How complete a brand list is, not how often each brand appears |
| Sielinski, July 2026 | No fixed collection budget can be justified across contexts | The ranking of cited domains, by platform and topic |
One St. Gallen author is also affiliated with Aurora Intelligence.
The St. Gallen figure deserves a careful read. Its authors report ±15.8 points at 7 runs, averaged over every brand detected at least once, rare ones included, and subsampled from 10 runs, which mechanically tightens the spread, as they point out. For a brand at 50%, my calculation gives ±29.8 points at 7 runs, ±12.3 at 60 and ±9.6 at 100. Measuring one prompt alone is expensive whichever study you pick.
For the level of a panel, the arithmetic tips the other way. Take 700 captures a week for a brand at 20%, assuming half the variance comes from differences between prompts (an illustrative assumption). 700 prompts captured once give ±3.0 points, 100 prompts captured 7 times give ±5.9, and 10 prompts captured 70 times give ±17.7. If prompts accounted for only 10% of the variance, the gap between the first two would narrow to ±3.0 against ±3.7. At equal budget, distinct prompts beat repeats, provided they really are distinct.
Why aren't 100 prompts worth 100 observations?
Prompts in one topic have good reason to move together: they trigger similar searches and draw on shared sources. No published result puts a number on it, so this remains my reasoning. If one page gains or loses its place, several prompts can flip at once.
A design effect is the factor by which similarity inside groups cuts the value of a sample. The formula goes back to Leslie Kish (1965): 1 + (m − 1) × ρ, where m is the number of prompts per group and ρ the correlation between prompts in a group. Your effective sample is the prompt count divided by that factor.
| Panel, brand at 20% | ρ = 0 | ρ = 0.05 | ρ = 0.1 | ρ = 0.2 |
|---|---|---|---|---|
| 50 prompts, 5 topics | ±10.9 | ±13.0 | ±14.8 | ±17.6 |
| 100 prompts, 5 topics | ±7.8 | ±10.8 | ±13.0 | ±16.5 |
| 100 prompts, 10 topics | ±7.8 | ±9.3 | ±10.6 | ±12.8 |
| 200 prompts, 10 topics | ±5.5 | ±7.7 | ±9.3 | ±11.9 |
| 500 prompts, 10 topics | ±3.5 | ±6.5 | ±8.4 | ±11.3 |
Author's calculation, 95% Wilson on the effective sample. The ρ values are assumptions: I found no published measurement for AI visibility as of 2 November 2026.
Look at the last column. Going from 100 to 500 prompts inside the same 10 topics buys 1.5 points. Going from 5 to 10 topics at a constant 100 prompts buys 3.7. With 10 topics and ρ = 0.2, the margin never falls below ±10.9 points, however many prompts you add. Your next prompts should open new subjects, not reword old ones.
You can estimate this margin from your own data without knowing ρ. Compute each topic's rate, take their standard deviation, divide by the square root of the number of topics, then multiply by the Student coefficient. With 5 equal topics at 12, 28, 15, 35 and 20% (made-up figures): mean 22%, standard deviation 9.5, standard error 4.2, coefficient 2.78, so ±11.7 points. The simple formula promised ±8.1.
Why are small brands the hardest to measure?
At a low rate, a margin that looks small in points stays huge in proportion. At 100 prompts, a brand observed at 2% was named twice, and its true rate sits between 0.6% and 7.0%. Total absence proves little more: by the rule of three, zero mentions in 50 prompts leaves a plausible rate of up to about 6%, and zero in 100 up to 3%.
Detecting a move then takes a volume few panels reach:
| Move to detect | Captures per period |
|---|---|
| 20% to 30% | 294 |
| 20% to 25% | 1,094 |
| 5% to 10% | 435 |
| 5% to 8% | 1,059 |
| 2% to 4% | 1,141 |
| 2% to 3% | 3,826 |
Author's calculation: two-sided test at 95%, 80% power, captures assumed independent.
To see 2% become 3%, 100 weekly prompts would need about 38 weeks per period. Another trap weighs more heavily here too. With 1% of false mentions (an illustrative rate), a brand at 40% reads 40.6%, while a brand at 2% reads 3.0%, an apparent 49% rise.
Three ways out, each with a cost. Narrow the panel to prompts where the brand has a chance of appearing, without adding prompts that already name your brand and inflate the score: the number gets more sensitive and covers less ground. Read counts: "3 prompts out of 100, then 6" stays honest where "+100%" misleads. Stretch the window to 8 or 12 weeks, and see things later.
How should you read a score week after week?
By comparing windows of several weeks on an unchanged panel. A frozen panel has one decisive advantage: each prompt acts as its own control, prompt choice cancels out in the difference, and only capture noise remains. Here is the smallest gap distinguishable from noise, at 95%, for a brand at 20%:
| Prompts | Week vs week (1 capture) | 4 weeks vs 4 weeks (4 captures) | 7 days vs 7 days, daily (7 captures) |
|---|---|---|---|
| 20 | 24.8 / 17.5 | 12.4 / 8.8 | 9.4 / 6.6 |
| 50 | 15.7 / 11.1 | 7.8 / 5.5 | 5.9 / 4.2 |
| 100 | 11.1 / 7.8 | 5.5 / 3.9 | 4.2 / 3.0 |
| 200 | 7.8 / 5.5 | 3.9 / 2.8 | 3.0 / 2.1 |
| 500 | 5.0 / 3.5 | 2.5 / 1.8 | 1.9 / 1.3 |
Author's calculation, in points. First figure: alike prompts. Second: contrasted prompts, with half the variance coming from differences between prompts (illustrative assumption, checked by simulation at 100 prompts). Captures assumed independent, no shared shock: these are floors.
Four weeks cut the floor in half. The St. Gallen study points the same way, averaged over series of one brand, one prompt and one engine at one capture a day: ±26.4 points over 7 days, ±15.7 over 14, ±6.5 over 28. I read that last figure as optimistic, since it rests on the spread of overlapping windows inside series of 40 to 46 days.
These floors ignore whatever hits every prompt at once. Semrush saw the share of ChatGPT responses citing Reddit go from close to 60% to around 10% between early August and mid-September 2025 (over 230,000 prompts, 13 weeks). No brand action explains a move like that, and no prompt volume protects you from it.
The test that captures everything is a null test. Take 8 to 12 weeks with no notable action, compute each week's gap with the one before, then multiply the standard deviation of those gaps by 1.96. That is an estimate of your real week-on-week floor, with clustering included, along with any shocks that hit during the period. To then attribute a move to your work, you need a control group: see the incrementality protocol.
Is daily tracking worth it?
Yes when timing matters or the panel cannot grow, no when it just gives you a number to read every day. Precision is set by the number of captures and the diversity of prompts, and cadence is only one way to get more captures.
Daily multiplies captures by 7, and those captures do seem to add information. At St. Gallen, two runs on the same day are no more alike than two runs on consecutive days (sources: 0.32 to 0.43 against 0.34 to 0.42; brands: 0.33 to 0.48 against 0.45 to 0.59). That is one study, in Swiss German, and its two sets of measurements do not cover exactly the same scope.
It earns its place in four cases:
- A dated event. A launch, a sale, a reputation crisis: waiting four weeks means reading too late. At 100 prompts, the week-on-week floor drops from 11.1 to 4.2 points for alike prompts.
- A panel that cannot grow. A narrow market does not offer 500 truly distinct questions.
- A low-rate brand. It needs over 1,000 captures per period.
- A few critical prompts. Over 28 days, a prompt at 50% reaches ±17.4 points: a strong trend becomes visible.
It turns into noise in two others:
- Day-by-day reading. A daily score has the same margin as a one-capture weekly score. With a 95% threshold, expect about 18 false alerts a year on a daily curve, against about 3 on a weekly one.
- Monthly decisions. If budget is set monthly and 200 prompts already give 3.9 points on a 4-week window, the gain changes no decision.
What don't these margins tell you?
They cover chance, not bias. Beyond ρ, three unknowns remain wide open as of 2 November 2026:
- What people actually ask. An interval assumes a random draw from real questions. As far as I know, no engine publishes volumes question by question, and 142 human-written prompts for one need show a mean semantic similarity of 0.081 (SparkToro). Your margin applies to your panel, not your market.
- Personalization. I found no peer-reviewed study of how memory or history changes brand recommendations.
- Other languages. The St. Gallen study covers Swiss German, and its authors warn the results may not carry over to other languages or regions. Applying it to French or English markets remains an assumption.
Where should you start?
- Write down the decision threshold. At what move do you change a budget or an editorial plan?
- Size for the smallest cell you read. My own rule-of-thumb benchmarks: around 100 prompts across at least 10 topics for an established brand, 30 to 50 prompts per topic read alone (±13.9 to ±10.9 points at 20%), 200 to 500 prompts or a narrower panel below 5%.
- Freeze the panel during a comparison. A prompt added mid-period changes the denominator and breaks the control.
- Compare 4-week windows. Then measure your floor with the null test.
- Log every break. A simultaneous move across all topics on one engine points first to the model rather than the brand.
Nanga's GEO module follows your prompts run after run, engine by engine, weekly by default and daily as an option. Topics and tags let you read a panel over several weeks, which is exactly where a measure becomes solid.
Period comparison, filters by topic and engine, and answer exports support the window reading and the null test.
The Nanga team has also observed that a model version can shift a series while the brand stands still. In October 2026, during a version change on one engine, a test on 10 prompts took the average citations per answer from 3.9 to 6.3. No statistical margin covers a break like that: date it and compare each side separately.
To read your AI visibility on your own prompts, window against window: request a demo.
Frequently asked questions
What is the margin of error of an AI visibility score?
It is the range where the true rate probably sits, given how much answers vary by chance. Using a 95% Wilson interval, a brand named in 20% of 100 answers sits between 13.3% and 28.9%, assuming the answers are independent.
How many prompts do you need to track AI visibility?
It depends on the move you want to detect. By a 95% Wilson calculation, 100 prompts give ±7.8 points for a brand at 20% and 500 prompts give ±3.5, before counting how alike prompts in a topic are. Compare your decision threshold with those margins first.
How many runs do you need per prompt?
For one prompt read alone, dozens. The University of St. Gallen recommends at least 7 runs a day with a window of 2 to 4 weeks; SparkToro suggests 60 to 100 runs. For a panel score, at equal budget, distinct prompts add more than repeats.
Is weekly tracking too infrequent?
Not in itself. Precision depends on the total number of captures and the diversity of prompts, not on the calendar. Read weekly tracking in four-week windows. Daily earns its place for a dated event, a panel that cannot grow, or a low-rate brand.
Sources:
- Uberti-Bona Marin et al., Maastricht University, Utrecht University and University of Zurich, "If I Had to Buy Just ONE: Galaxy S26 Ultra": Auditing AI-Generated Product Recommendations, September 2026.
- Schulte, Bleeker and Kaufmann, University of St. Gallen, Don't Measure Once: Measuring Visibility in AI Search (GEO), April 2026.
- SparkToro, NEW Research: AIs are highly inconsistent when recommending brands or products; marketers should take care when tracking AI visibility, January 2026.
- Żatuchin, Measuring Brand and Source Discovery under Repeated LLM Queries: A Finite-Sample Audit, September 2026.
- Sielinski, From Stochastic to Stable: Rank Stability and Structural Sufficiency in AI Visibility Measurement, July 2026, revised in August.
- NIST/SEMATECH, e-Handbook of Statistical Methods, section 7.2.4.1, Confidence intervals, accessed November 2026.
- Wikipedia, drawing on Kish, Survey Sampling (1965), Design effect, accessed November 2026.
- Wikipedia, Rule of three (statistics), accessed November 2026.
- SE Ranking, AI Overviews just launched in France, and they already appear on more than 52% of searches, August 2026.
- Semrush, The Most-Cited Domains in AI: A 3-Month Study, November 2025.