
In the United States, ChatGPT is used about 30 times as much as Perplexity. Yet a standard AI visibility score settles for a plain average, where every AI counts as much as the next.
On November 18, 2026, Nanga GEO added a new mode, "By audience". When it's on, each AI is weighted by how much people in the tracked country actually use it. When it's off, every AI counts equally, as before.
An example: from 35% to 24%
Take a brand tracked on 4 AIs. It shows up in 20% of ChatGPT's answers, 30% of Gemini's, 40% of Claude's and 50% of Perplexity's.
| AI | Brand visibility | Equal weight | By audience (United States) |
|---|---|---|---|
 ChatGPT | 20% | 25% | 72% |
 Gemini | 30% | 25% | 19% |
 Claude | 40% | 25% | 6% |
 Perplexity | 50% | 25% | 2% |
| Score | 35% | 24% |
With equal weights, the brand scores 35%. Weighted by audience, it drops to 24%, because the brand is weakest on ChatGPT, the one people use most. Both figures are right; they just answer different questions. The first averages the AIs, the second tells you whether the brand is visible where users actually are.
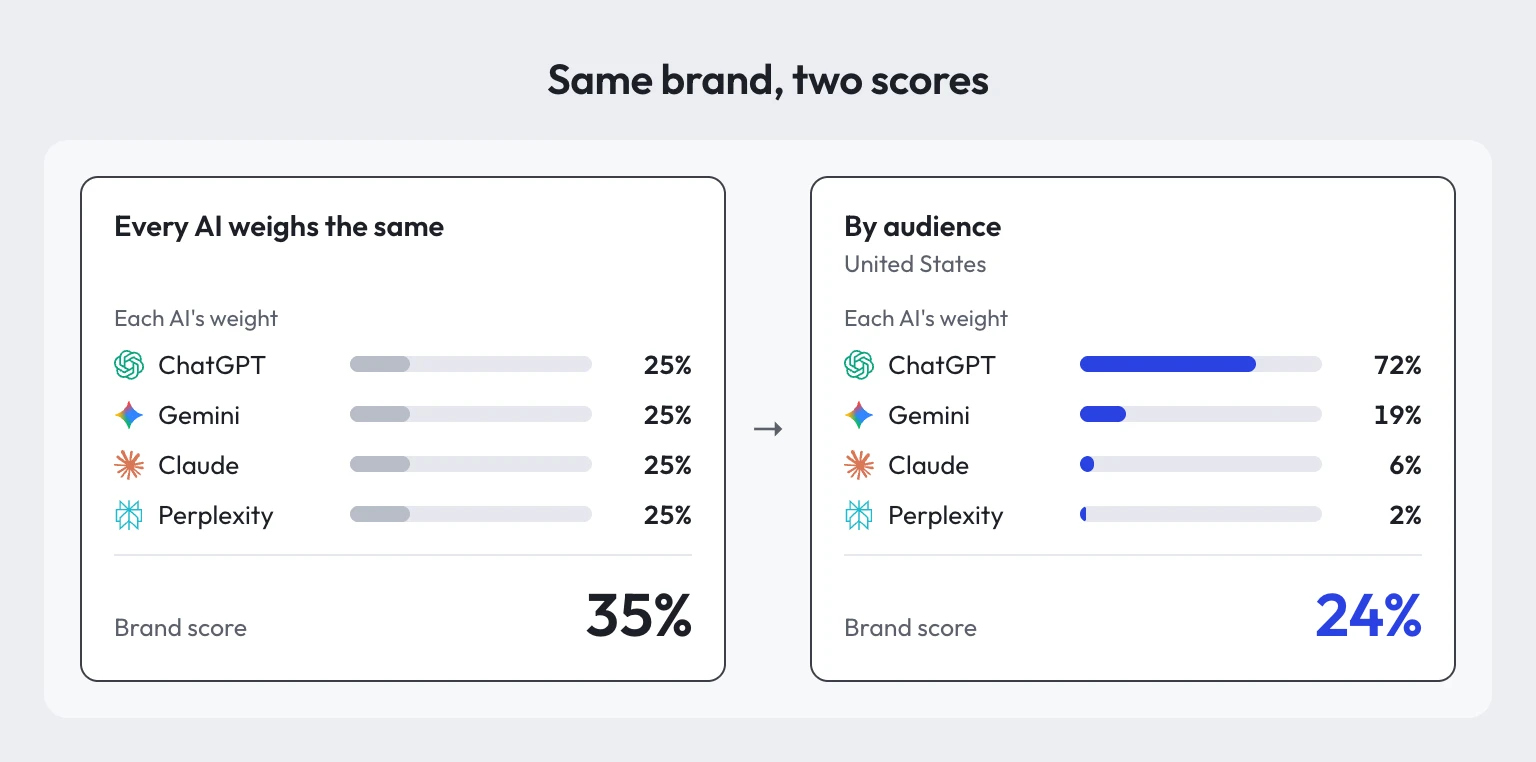
Same brand, two scores. Weights by audience: Nanga GEO, United States, November 2026.
Where the weights come from
No single source measures AI usage, and no two ever give quite the same figure. So Nanga combines several per country and takes the median for each AI (the average when there are only two).
For the United States, it uses three public sources:
- Similarweb: visits to each AI's website.
- Statcounter: the clicks each AI sends to websites.
- Pew Research Center: the share of adults who use each AI.
For a project tracking these 4 AIs, that gives ChatGPT 72%, Gemini 19%, Claude 6% and Perplexity 2%. Six countries have their own set of weights (the United States, France, the United Kingdom, Germany, Spain and Italy); all others use a worldwide set.
Only the AIs a project tracks are counted, and their weights are rescaled to add up to 100%. If an AI didn't answer a prompt, it's simply left out for that prompt: a missing answer never counts as a zero.
What about Google AI Overviews?
AI Overviews are the summaries Google shows above its search results. A prompt stands for an intent: the person types it into an AI assistant or into Google, where they only see an AI answer if an AI Overview shows up. So the weight of AI Overviews is worked out in two steps.
- Search still gets far more use. On desktop in the United States, traditional search, led by Google, accounts for 10.5% of web activity, almost six times the 1.8% of all AI assistants combined (Datos x SparkToro, Q2 2026).
- Not every search shows an AI Overview. Nanga measures how often one appears on the project's prompts. When it has no measurement, it falls back on the rate published by SISTRIX: 84.6% of keywords in the United States, on mobile, as of November 17, 2026.
Multiply the two, then rescale so the total is 100%. AI Mode gets the small share Datos x SparkToro measures for it.
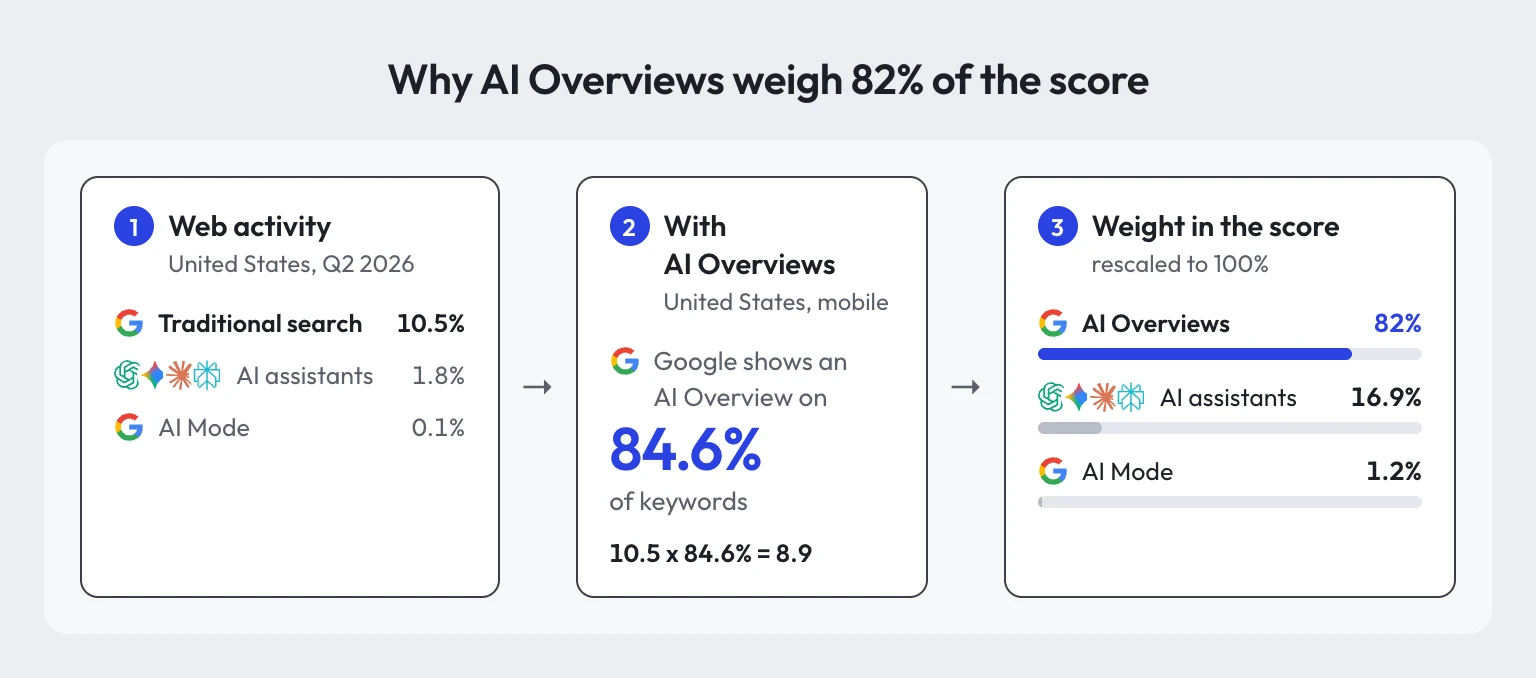
The calculation in three steps. Web activity: Datos x SparkToro, United States, Q2 2026. Display rate: SISTRIX, United States, mobile, November 17, 2026.
For a US project tracking all 7 AIs, with the SISTRIX rate (replaced by the project's own once measured):
| AI | Weight by audience |
|---|---|
 Google AI Overviews | 82% |
| ChatGPT | 11% |
| Gemini | 3% |
| Google AI Mode | 1.2% |
| Copilot | 1.2% |
| Claude | 1% |
| Perplexity | 0.4% |
The assistants share the remaining 16.9%: ChatGPT weighs 11% here, against 72% in a project tracking only the 4 AIs of the example.
One caveat: this 82% is the weight of AI Overviews in the score, not their share of traffic. An AI Overview can appear without anyone reading it.
Where to find it in Nanga GEO
The "By audience" mode sits in the filter bar, next to the date range. It's off by default, and each user turns it on for themselves.
Once it's on, it recalculates every figure that combines several AIs: AI Visibility, Share of Voice, Source Share, sentiment and position, competitor rankings, topics and prompts, the presence matrix, the source flow and the searches AIs run (fan-out). Each AI's own results don't change. Raw counts, such as the number of source pages, stay as they are, with their share by audience shown alongside.
The (i) icon opens the method, with each AI's weight for the project, the full calculation, its limits and linked sources.
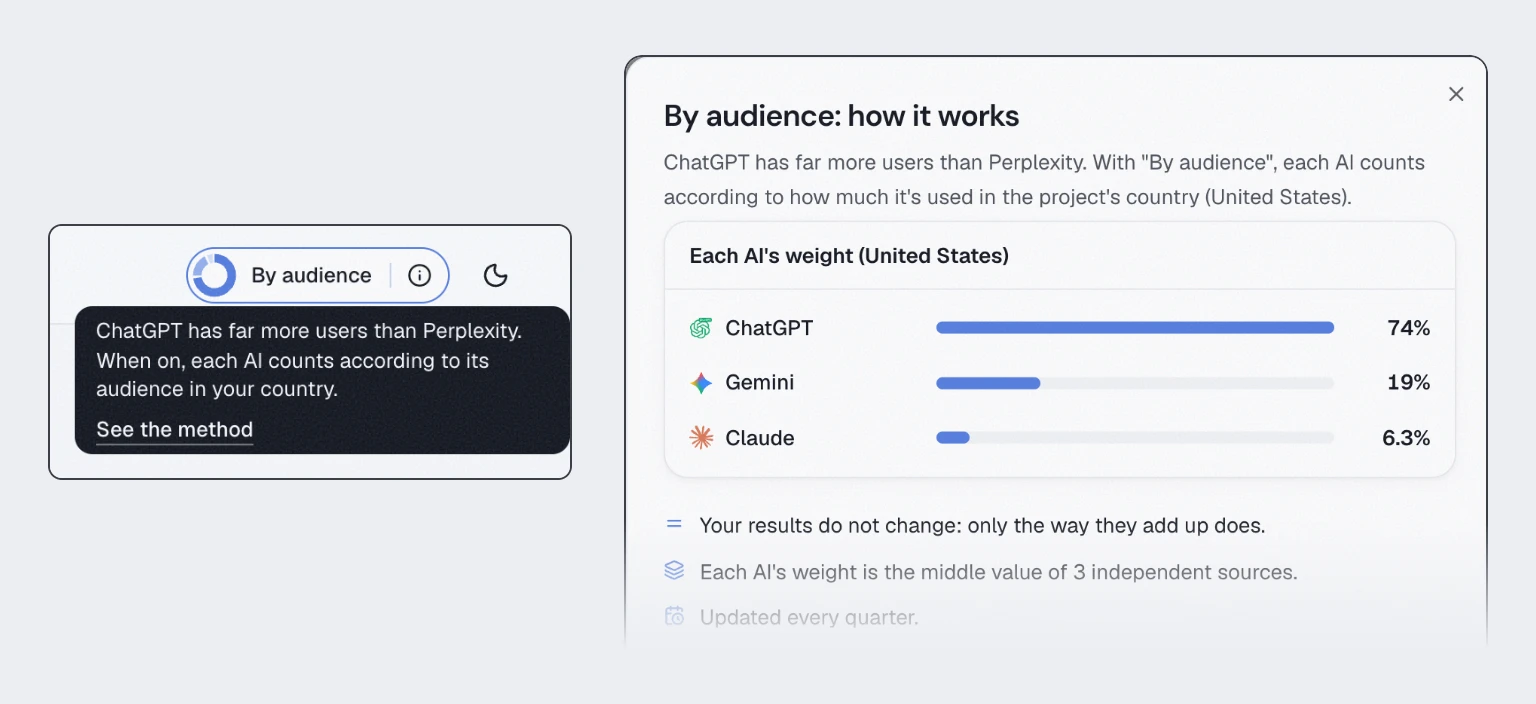
The "By audience" mode and its method. Screenshot of the Nanga GEO demo project, tracked on 3 AIs in the United States, where ChatGPT weighs 74%.
Limitations
- Sources disagree. In the United States, Claude weighs 1.9% at Statcounter, 5.3% at Pew and 14.8% at Similarweb. The median keeps any single source from deciding.
- Mobile apps are harder to measure than the web. Panels mostly see what happens in browsers.
- The two AI Overview measures cover different screens. Web activity is measured on desktop, the SISTRIX rate on mobile.
- AI usage moves fast. Nanga reviews the weights every quarter and applies the new weights to all past data, so periods stay comparable.
Frequently asked questions
What is a usage-weighted AI visibility score?
It's a score in which each AI counts in proportion to how much it's used in the tracked country, instead of every AI counting equally. In Nanga GEO, the "By audience" mode applies it to every figure that combines several AIs. Each AI's own results don't change, only their average does.
Where do the assistant weights come from?
In the United States, from three public sources: Similarweb (visits), Statcounter (referrals sent to websites) and the Pew Research Center (share of adults using each AI). For each AI, Nanga takes the median. Six countries have their own set of weights: the United States, France, the United Kingdom, Germany, Spain and Italy. All others use a worldwide set.
How is the weight of Google AI Overviews calculated?
Traditional search's share of web activity (Datos x SparkToro) is multiplied by how often Google shows an AI Overview, which Nanga measures on the project's prompts. When it has no measurement, it falls back on the rate published by SISTRIX: 84.6% of keywords in the United States, on mobile, as of November 17, 2026. Everything is then rescaled to 100% with the assistants and AI Mode.
Why do AI Overviews weigh so much?
Because traditional search, led by Google, still gets far more use than AI assistants: on desktop in the United States, it accounts for almost six times as much web activity. That weight reflects how much AI Overviews count in the score, not how much traffic they send.
Are the weights updated?
Yes, every quarter. New weights are applied to all past data, so periods stay comparable. Updating the weights never touches each AI's own results.
Sources:
- Similarweb, via Momentic, Top AI chatbots, October 2026 data.
- Statcounter Global Stats, AI chatbot market share, United States, September 2026.
- Pew Research Center, Americans and AI in 2026, February 2026 survey.
- Datos x SparkToro, State of Search Q2 2026, June 2026.
- SISTRIX, Google Update Radar, United States, mobile, accessed November 17, 2026.
- For other countries: Médiamétrie for Arcom (France, April 2026), Bitkom Research (Germany, June 2026), Reuters Institute (worldwide grid, September 2026).